It is used to map entities such as samples, domains IPs and malware families to share a bond between them.

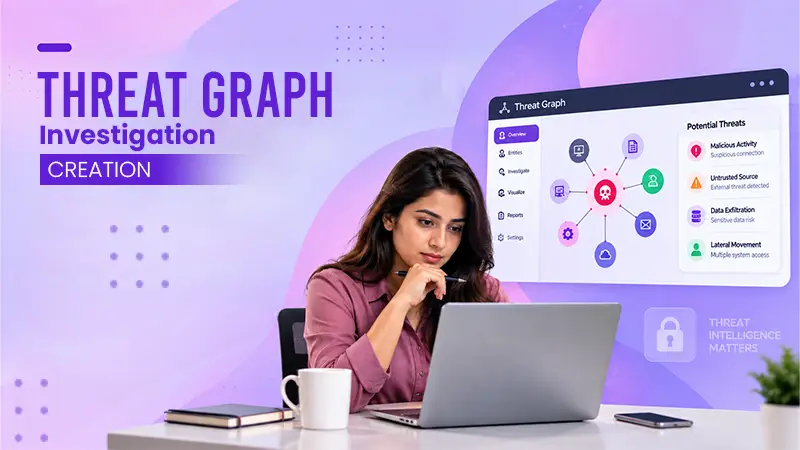
Quick answer: A pile of indicators can be turned into a case with structure. Simply seed the graph, expand relevant nodes, enrich key data and export it after documenting findings.
A list of malware indicators is just the beginning point of an investigation. At its core, it does not provide any potential aspect for research—crucial elements are required. This includes a defined connection between different samples, domains and IPs and the importance this holds.
Whereas a threat graph provides required information in a defined way by converting entities into nodes and relationships into edges.
This way, using the right approach and tools like a free malware analyzer, the process can be made effective. Keep reading to explore how to build a threat-graph investigation.
BEFORE YOU START Graph pivots and native enrichment use a free daily allowance first, then spend credits. Enrichment through a provider where you have supplied your own API key is not charged. Add your keys under Keys before you start enriching — five minutes there will save you most of your credit spend on this case.
There are three ways in, and they suit various starting points.
| Seed from | How | Best when |
|---|---|---|
| Pasted indicators | Paste into the seed box — one per line or comma-separated. SHA-256, MD5, SHA-1, domains, IPs and URLs are all recognized and typed automatically. | You are coming out of a hunt (Part 4) or an activity ticket with a known list. |
| An uploaded document | Upload a PDF, JSON, CSV, STIX or MISP bundle, an .eml, a zip, or any binary. Indicators are drawn for you. | You are benefiting from a vendor report, a phishing email, or a partner’s intel package. |
| A report | Turn into the graph from a sample or URL report. | You just finished Part 1 or Part 2 and want to go outward from a single established artifact. |
Name the case right away, in the Case name field, and use a name your future self will recall — the ticket number plus the family, not “test 3”. Set the visibility level: Private is the default and the right answer for anything customer-related; Public makes the case downloadable.
The Add node menu must have a type and a value, which helps you put things in the graph that no automatic extraction would detect: Sample, File, Domain, IP address, URL, Malware family, Campaign and Mutex.
The last three are the ones analysts neglect to use, and they are what make the graph an audit rather than an indicator dump. A Campaign node gives the case a sturdy foundation to hang clusters from. A Malware family node helps you state attribution explicitly instead of leaving it implied. A Mutex node stores the kind of artifact that ties two otherwise disparate samples together far more effectively than a shared hosting provider. Select two nodes and use Link selected to record the interaction you believe exists.
Double-click a node to enhance it. That single action is most of the tool. A sample stretches to its infrastructure and relatives; a domain to its specs, URLs and the samples that contact it; an IP to any data it has hosted.
The batch endpoint does the same across many variables at once:
POST /v1/graph/pivot # batch multi-IOC pivot (metered / credited)
Resist the request to expand everything. A graph with four hundred nodes is not a richer study; instead, it is an unreadable one — and every rise costs an action. Two rules keep it useful:
THE SHARED-INFRASTRUCTURE TRAP: A bulk hosting provider, a CDN, a parking IP or a popular dynamic-DNS domain will attach anything to anything. When an expansion delivers a hub node with hundreds of unused edges, that node is infrastructure, not a link. Prune it or mark it, and never let it serve as an attribution claim.
Enrichment involves adding external context to a node: reputation, hosting and ASN data, open ports, passive DNS, abuse history. Use Enrich on defined nodes, or Enrich all for the whole graph.
A malware analyzer can make this enrichment useful by connecting technical parameters with reputation, infrastructure, and abuse data, but the primary objective is to enrich the nodes that matter to your assessment.
POST /v1/graph/enrich # native providers, plus bring-your-own-key providers
# e.g. VirusTotal, Shodan, AbuseIPDB and others
| Enrichment route | Cost |
|---|---|
| Native enrichment | Free daily actions first, then credits. |
| A provider where you shared your own API key (under Keys) | Not charged by the platform — you are using your own quota with that service company. |
The practical implications: add your own keys before a large case, and enrich cautiously rather than reflexively. Adding meaning to every node in a hundred-node graph gives you a hundred nodes of context you will not read. Enrich the nodes that are heavy-duty in your conclusion.
Also, learn how to build strong digital compliance programs.
Layout is not decor — the layout you choose dictates what a reader notices. Five are available, plus Fit and Full screen.
| Layout | Reads as | Use for |
|---|---|---|
| fcose | Organic force-directed clustering (the default). | Exploration. Clusters and outliers arise on their own. |
| dagre | A directed, layered structure. | Chains: delivery → loader → payload → C2. The best layout for a report figure. |
| concentric | Rings around the most connected node. | Showing that one entity is integral to the case. |
| grid | Uniform rows and columns. | Inventory views and screenshots where every node must be identifiable. |
| circle | All nodes on one ring. | Equalizing edge density without positional bias. |
Explore in fcose; publish in dagre. A hierarchical figure with eight nodes will explain to a reader that a force-directed hairball with eighty never will.
Now is the time to include two comparison tools to sort of the results that will not be supporting the final results:
When the graph joins two samples together, affirm it rather than asserting it. Compare (/diff) takes two SHA-256 hashes and diffs verdict, structural similarity, IOCs, abilities and ATT&CK mapping. “Same family, repacked” and “same actor, different tool” look very similar on a graph and completely opposite in a diff.
ATT&CK (/attack) gives technique density across the corpus with a per-technique pivot into adjacent samples, and exports a MITRE ATT&CK Navigator layer. Two uses inside a case: check whether the techniques your samples use are typical or unusual in the wider corpus, and overlay the layer on your own detection coverage map to illustrate which specific elements of this campaign you would currently miss.
Press Save. A saved case is a durable probe that you can reopen, extend and hand over, and it lives alongside the collections API:
GET /v1/investigations # saved CTI cases: graph snapshots, notes, exports
GET /v1/collections # list your investigations
POST /v1/collections # create one: samples + IOCs + notes
Write the notes while the argument is fresh, and write them for someone who was not there. Four things belong in an individual case:
SNAPSHOT, NOT A LIVE FEED A saved graph is a point-in-time record. Infrastructure moves, domains get taken down, and the results change as engines update. Date every case and re-check the load-bearing nodes before you click on an old one.
Below is how to export the right format for the person viewing it. The better the format is, the better the responses will be:
| Format | Audience | Notes |
|---|---|---|
| PNG, SVG | Reports, slides, tickets. | Free. Lay out in dagre first and prune before exporting. |
| Formal deliverables. | Premium export — spends credits. | |
| STIX | A TIP, or a partner exchanging structured intel. | Premium export — spends credits. The right choice when the receiver has machinery. |
| MISP | A MISP instance or a sharing community. | Premium export — spends credits. |
| CSV | Spreadsheets, blocklists, SIEM watchlists. | Free. The pragmatic choice for most internal handoffs. |
| GraphML, JSON | Your own tooling, Gephi, custom analysis. | Free. GraphML keeps the topology; JSON keeps everything. |
Match the export to what the recipient can ingest. A STIX bundle sent to someone who will launch it in a text editor helps nobody; a CSV of forty indicators fed into a SIEM watchlist gets executed on the same afternoon.
Here are some common mistakes that need to be considered for a good quality of results:
| Mistake | Why it bites |
|---|---|
| Expanding everything | Every expansion implicates an action and adds noise. A big graph is not a potent graph. |
| Enriching before adding your own provider keys | You spend credits on data your own API quota would have provided free. |
| Treating shared hosting as a relationship | Hub nodes connect unimportant things. This is the most prevalent source of bad attribution. |
| Leaving inferences unmarked | A hand-drawn edge is impossible to differentiate from an identifiable one once you have closed the tab. |
| Publishing the exploration layout | A force-directed hairball loses the reader. Change to dagre and prune. |
| Saving without notes | A graph without reasoning is a symbolic representation. In six months it will not even be that. |
| Acting on an old case without re-checking | Infrastructure rotates and rules change. Re-verify the nodes your conclusion is founded on. |
Also, learn how to align your threat and vulnerability management strategy with SOC operations.
In the end, a useful threat graph is not the one with the most nodes. Rather, it is the one that simply shares the relationship, evidence and reasoning behind the investigation. Seed the case carefully, expand with a defined question and enrich only the nodes that act as a helping hand for the end results.
The other most important aspect is to clearly note down what is observed, what comes out as a conclusion, and what is not checked. A clean graph is much more effective for the next analyst than a huge collection.
It is used to map entities such as samples, domains IPs and malware families to share a bond between them.
Begin with known indicators, reports, or a confirmed artefact and give the case a clear name.
They share what was observed, what was inferred, your confidence level, and what still needs to be checked.